









Why is Neighborhood analytics dashboard important?
A neighborhood analytics dashboard is a digital platform that consolidates location-based data, market trends, demographics, infrastructure information, and property performance metrics into interactive visual reports. Used extensively in PropTech and real estate, these dashboards help developers, investors, brokers, urban planners, and government agencies evaluate neighborhood characteristics and make informed property decisions. By presenting multiple datasets in a single interface, neighborhood analytics improves market transparency and investment accuracy.
How a Neighborhood Analytics Dashboard Works
- Data is collected from property transactions, census records, transport networks, public services, and market sources.
- The information is displayed through maps, charts, and interactive dashboards.
- Users can compare neighborhoods based on pricing, demand, amenities, crime rates, and infrastructure.
- Analytics tools identify trends that support investment and planning decisions.
Why It Is Important
- Improves property investment and site selection decisions.
- Provides comprehensive market intelligence in a single platform.
- Supports urban planning and infrastructure development.
- Helps identify emerging real estate growth corridors.
Applications in PropTech
- Residential and commercial property analysis.
- Real estate investment research.
- Urban development planning.
- Location-based marketing and portfolio management.
Neighborhood analytics dashboards enable stakeholders to evaluate communities using reliable, data-driven insights rather than assumptions. Their ability to combine geographic, demographic, and market information supports smarter investment strategies, improved planning, and more efficient real estate decision-making.

Recent Glossary
What are the benefits of z-score based property risk modeling?
What are the benefits of zakat calculation on real estate assets?
How is zero-emission construction equipment used in real estate?
How do zonal price index for urban housing markets work?
What is the meaning of zero-touch tenant onboarding technology?
View More...
Recent FAQs
What is the difference between a rent-to-own agreement and a traditional lease-purchase option?
Which is generally more liquid for investors: a publicly traded REIT or a private real estate fund?
What is the difference between a real estate wholesaler's assignment fee and a broker's commission?
How do investors stress-test a real estate underwriting model for a recession scenario?
What is a waterfall distribution structure in a real estate joint venture agreement?
View More...
Insight Pulse
Uncategorized
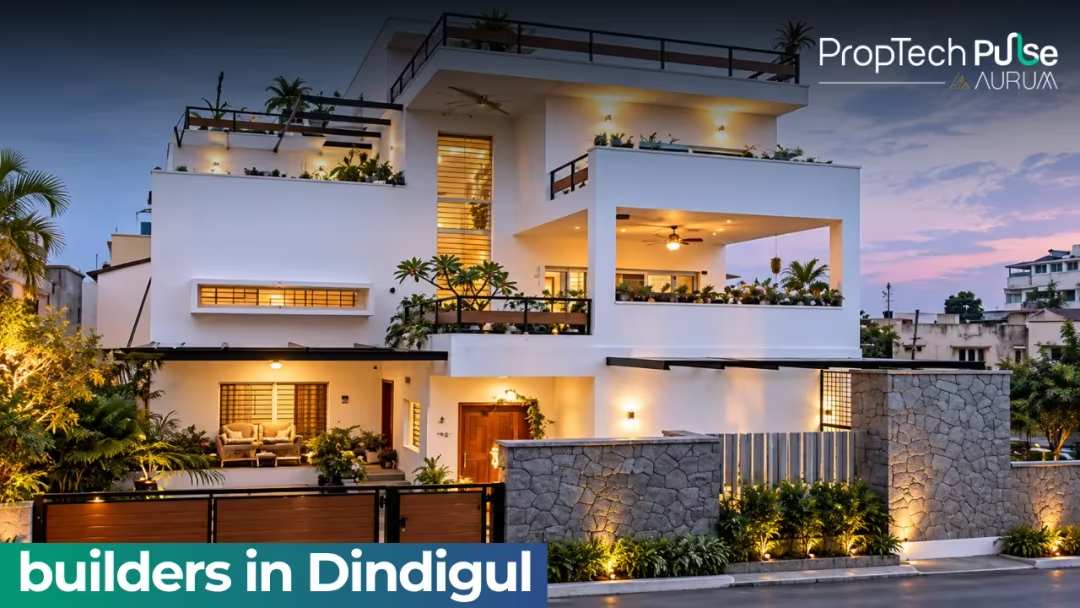
Builders in Dindigul 2026: Homes Built for Modern Living
Dindigul is an important city and district in southern Tamil Nadu. Its market covers land plots, independent homes, apartments, villas, and commercial properties. The district also includes well-known towns like Palani, Batlagundu, Oddanchatram, and Kodaikanal, giving buyers a lot of choice beyond just Dindigul city. Land and plotted developments are a big part of this market, more so than in many other Tamil Nadu cities. Choosing a builder takes more than comparing brand names. Always check location, title, approvals, and construction quality. In this guide, we will look at the top builders in Dindigul. How We Picked These Companies There is no official government list for this. So we used a simple method. We looked at: How active the company is across Dindigul district What kinds of projects it builds Its presence in trusted property listings and TNRERA records Public facts, where available This list is a guide, not an investment tip. The Top 10 Builders in Dindigul 1. VR Builders Works in: Nallampatty, Seelapadi, Chettinayakampatti, Thadikombu, Kodaikanal Builds: Homes, villas, and land plots VR Builders is based in Dindigul, with an office in R.M. Colony. Its portfolio spans independent houses, villas, and land across several parts of the district. This makes it a good name for buyers looking beyond apartments, toward independent homes or land. 2. G Square Housing Works in: Ponnagaram, Dindigul Builds: Land plots G Square Housing focuses mainly on plotted development across South India, including a project called G Square Blue Hills in Ponnagaram. This makes it a good option for buyers who want to purchase land and build their own home later. Always verify layout approval, title, and utility infrastructure before buying a plot. 3. V City Developers Works in: Batlagundu Builds: Land plots V City Developers has two projects, V City Kodai Grand Legacy and V City Kodai Vels Garden, both in Batlagundu. One sits along the Batlagundu-Kodaikanal road, making it relevant for buyers considering the route toward Kodaikanal. 4. Casagrand Works in: Pallangi, Kodaikanal Builds: Land plots Casagrand is a major Chennai-based developer with a wider presence across Tamil Nadu. Its Dindigul district projects include Casagrand The Hilltop Phase 1 and Casagrand Hillmont, both plotted developments in Kodaikanal. Always assess the specific project rather than assuming the company's broader reputation applies equally everywhere. 5. Mani Property Developers Works in: Vadamadurai, Dindigul Builds: Land plots Mani Property Developers is headquartered in Karur and also works across Tiruchirappalli, Coimbatore, and Dindigul. It has residential plot offerings in Vadamadurai. This makes it relevant for buyers researching property in the wider Dindigul district, not just the city center. 6. Dream Properties Kovai Works in: Oddanchatram Builds: Homes and land Dream Properties Kovai is based in Coimbatore but has property activity in Oddanchatram, in western Dindigul district. The company describes its work as covering planning, design, construction, and marketing of real estate. Always check the exact location and ownership documentation for any specific property. 7. LandHub Properties Works in: Chinnalapatti, Dindigul Builds: Land and property services LandHub Properties is based in Tiruchirappalli and lists Dindigul among the areas it serves, including activity around Chinnalapatti. The key focus should always be the individual property and its documentation, not just the company name. 8. Shri Anugrahaa Homes Works in: Vilpatti, Kodaikanal Builds: Land plots Shri Anugrahaa Homes has a plotted project called Shri Anugrahaa Heavenly Haven Plots in Vilpatti. This makes it relevant for buyers interested in land around Kodaikanal and the hill-station market. Kodaikanal properties need extra checks on terrain, road access, and water availability. 9. Elephantine Enterprises Works in: Moonjikal, Kodaikanal Builds: Land plots Elephantine Enterprises started in 2013 and works across Chennai, Kodaikanal, and Dindigul. Its project, Elephantine Tales in Moonjikal, is a large plotted development in the district. Always examine title, land use, and access carefully for Kodaikanal land. 10. Sowrem Promoters Works in: Kodaikanal, Dindigul district Builds: Land plots and villas Sowrem Promoters started in 2012 and has a project called Onyx Paradise, offering residential plots and villas in Kodaikanal. The company says the project has DTCP approval and RERA registration. Check the exact location, terrain, and documentation carefully before investing in hill-station property like this. How We Ranked These Companies We did not use brand fame alone to rank these builders. Local presence mattered a lot. We wanted companies genuinely active across Dindigul district, including its smaller towns. Listing activity was checked too. We looked at how often each builder appeared in trusted property listings. Project variety was another factor, including homes, villas, and land plots. Public information helped confirm what facts we could verify. Because of this method, our list may differ from other lists online. That is normal, since different methods lead to different results. Where to Buy: Key Areas in Dindigul Dindigul city is the district's main urban center, with established neighborhoods, schools, and hospitals. Palani is a well-known town, supported by tourism, religious travel, and local commerce. Batlagundu sits strategically on the route toward Kodaikanal, popular for plotted development. Oddanchatram is an important commercial and agricultural center, home to activity from Dream Properties Kovai. Nilakottai is another established town, with a mix of independent houses and plotted developments. Kodaikanal is its own distinct property market, attracting interest in villas, plots, and holiday homes. Several developers, including Casagrand and Sowrem Promoters, are active here. Since the terrain and environment are different from the plains, always do extra checks before buying land here. Types of Homes Available in Dindigul 2 BHK flats suit small families and first-time buyers, though apartments are just one part of this market. Check carpet area and maintenance before deciding. 3 BHK flats suit bigger families, though availability varies a lot between Dindigul city and smaller towns. Compare actual usable area, not just the advertised size. Residential plots are a big part of the local market, spread across Dindigul city, Batlagundu, Palani, and other towns. Always verify title, layout approval, and utility access. Independent houses and villas offer more privacy than apartments. Check both land documents and building approvals before buying. Commercial property is in demand too, thanks to Dindigul's role as a business center. Check visibility, access, and tenant demand before investing. What to Check Before Choosing a Builder Being on this list does not mean every project is perfect. Always check the details yourself. Here is a simple checklist: TNRERA registration. Check the official portal for promoter and project details. Land and layout documents. Especially important for plots. Verify ownership, layout approval, and road access. Location. Check proximity to schools, hospitals, and major roads. For Kodaikanal, also check terrain and road conditions. Site inspection. For finished homes, inspect the building yourself. For under-construction ones, compare actual progress with what's registered. Full cost. Add up registration, taxes, maintenance, and other charges beyond the base price. The agreement. Read the sale agreement and property documents carefully. Get legal advice for larger purchases. Doing this small bit of homework can save you a lot of trouble later. Why New Projects in Dindigul Deserve a Closer Look Dindigul district continues to see new property registrations, spanning both residential buildings and plotted layouts across areas like Palani, Athoor, and Oddanchatram. Builders like V City Developers, G Square Housing, Casagrand, and Elephantine Enterprises all have active projects across the district and Kodaikanal. Always tell the difference between a genuinely new launch, an under-construction project, and an older property being resold. Check regulatory records before making a booking. Final Thoughts Dindigul has a wide mix of local and regional builders, with a strong focus on land and plotted development. VR Builders, G Square Housing, and V City Developers bring solid local and regional experience. Casagrand, Mani Property Developers, and Dream Properties Kovai add more choices across the wider district. LandHub Properties, Shri Anugrahaa Homes, Elephantine Enterprises, and Sowrem Promoters round out the list, mostly focused on Kodaikanal's land market. This list is a good place to start if you are exploring real estate in Dindigul. But no list can pick the perfect home for you. Always check the RERA status, legal papers, location, and price. Visit the site. Ask questions. A little research today can help you make a smart choice tomorrow. Disclaimer: This ranking is for general information only. It is based on publicly available facts. Rankings may change based on new data and methods. Please do your own research before making any real estate or investment decision. Enjoyed this blog article? Visit PropTech Pulse for more interesting blogs.

PropTech Pulse Editorial
17th September 2026
Uncategorized
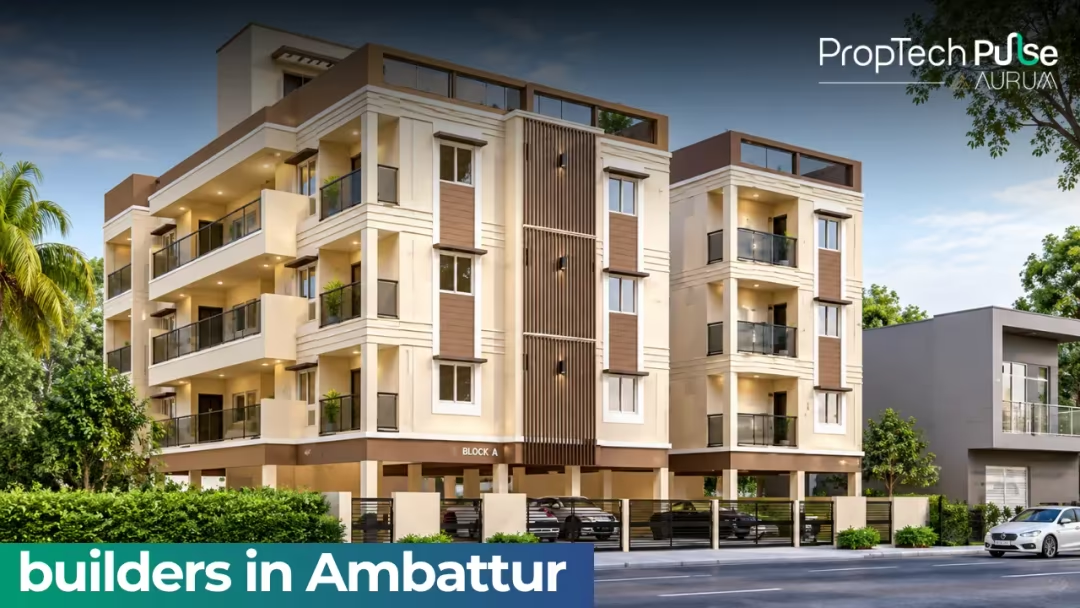
Builders in Ambattur 2026: Homes Built to Last
Ambattur is an established area in western Chennai, known for both its residential neighborhoods and its industrial roots. Its location gives easy access to Padi, Mogappair, Anna Nagar, Avadi, and Korattur, making it a popular choice for both homebuyers and investors. Buyers here can find apartments, land plots, villas, and commercial spaces. Choosing a builder takes more than checking company names. Always look at location, construction quality, and total cost. In this guide, we will look at the top builders in Ambattur. How We Picked These Companies There is no official government list for this. So we used a simple method. We looked at: How active the company is in and around Ambattur What kinds of projects it builds Its presence in trusted property listings and TNRERA records Public facts, where available This list is a guide, not an investment tip. The Top 10 Builders in Ambattur 1. VGN Projects Estates Works in: Ambattur Builds: Homes and land plots VGN Projects Estates is an established Chennai developer with a strong Ambattur history. Its project, VGN Brent Park, is a CMDA-approved plotted development covering 9.52 acres with 204 plots. This makes VGN a good name for buyers comparing established developers who offer both plots and homes. 2. Casagrand Works in: Near Mogappair Builds: Homes Casagrand is one of Chennai's established residential developers, with a completed project called Casagrand Athens near Ambattur and Mogappair, offering 2 BHK apartments across 953 units. The company also has two newer projects, Casagrand Linore and Casagrand Ventra, serving the Ambattur area. This gives buyers a mix of finished and new options from the same builder. 3. RWD Works in: Ambattur Builds: Homes and offices RWD has more than 15 years of experience and says it has completed over 13.5 million square feet of development. Its project, RWD Lemongraz, is a residential development directly in Ambattur. This makes RWD worth checking for buyers who want an established apartment community. 4. Voora Property Developers Works in: Ambattur Builds: Offices Voora Property Developers started in 1995 as a family-run business. Its project, Voora Tech Edge, is a commercial development positioned as a premium office space in Ambattur. This makes Voora a good pick for investors wanting commercial property rather than homes. 5. G Square Housing Works in: Ambattur and other parts of Chennai Builds: Land plots G Square Housing focuses mainly on plotted developments across Chennai and Tamil Nadu. The company has activity linked to the broader Ambattur plotted market. For plots, always check the title, land use, approvals, and road access before buying. 6. Sree Guru Foundations Works in: Ambattur Builds: Homes Sree Guru Foundations has a residential project called Sree Guru Pragathi, offering 3 BHK homes and currently ready to move in. This makes it relevant for buyers specifically looking for larger apartments in Ambattur. For smaller, local builders like this, check their finished projects and promoter details closely. 7. GP Homes Works in: Ambattur Builds: Homes GP Homes has two projects in Ambattur: GP Fern Breeze and GP Homes Fern Breeze Diamond, offering 2 and 3 BHK homes. Compare carpet area, location, and amenities across its projects before deciding. 8. Local Plotted Developers Works in: Ambattur Builds: Land plots Beyond the bigger names, Ambattur also has smaller local promoters offering plotted developments alongside established names like G Square Housing. For plots, a developer's experience is only part of the picture. Always check land title, drainage, water access, and electricity connections directly. 9. Nature Residences Development Works in: Vanagaram-Ambattur Road Builds: Homes Nature Residences Development has a project called AYANA, offering 185 homes and currently under construction, with CMDA approval on record. For under-construction homes like this, check the registered project details, construction progress, and expected finish date. 10. Cinnamon Homes Works in: Mogappair, within the wider Ambattur zone Builds: Homes Cinnamon Homes has a smaller residential project in Mogappair, officially registered with Tamil Nadu RERA, with 20 homes. For smaller developers like this, focus on project-specific verification rather than relying on brand familiarity alone. How We Ranked These Companies We did not use brand fame alone to rank these builders. Local presence mattered a lot. We wanted companies genuinely active in and around Ambattur. Listing activity was checked too. We looked at how often each builder appeared in trusted property directories and TNRERA records. Project variety was another factor, including homes, offices, and land plots. Public information helped confirm what facts we could verify. Because of this method, our list may differ from other lists online. That is normal, since different methods lead to different results. Where to Buy: Key Areas in Ambattur Ambattur OT is one of the area's established parts, with good access to buses, shops, and schools. The Ambattur Industrial Estate is a key employment hub, supporting steady rental and housing demand nearby. Menambedu offers apartments and independent homes within the wider western Chennai residential belt. Athipattu has seen newer development along the Vanagaram-Ambattur Road, including larger apartment projects. Mogappair is a major nearby market, with established housing, schools, and healthcare facilities. Korattur offers good railway connectivity and sits close to Ambattur, Padi, and Anna Nagar. Types of Homes Available in Ambattur 2 BHK flats suit small families, professionals, and first-time buyers. Check carpet area and maintenance charges, not just the price. 3 BHK flats suit bigger families needing more space. Compare actual room dimensions, since usable space can vary between similarly sized homes. Land plots are common here too, including projects like VGN Brent Park. Always verify title, approvals, and access roads before buying. Villas and independent homes are more common in the outer parts of the Ambattur-Avadi belt. Check land ownership and construction quality carefully. Commercial property is in demand thanks to Ambattur's industrial base. Voora Tech Edge is one current example. Always check accessibility and tenant demand before investing. What to Check Before Choosing a Builder Being on this list does not mean every project is perfect. Always check the details yourself. Here is a simple checklist: TNRERA registration. Check the official portal for promoter details, project status, and approvals. CMDA approvals. Ambattur falls within Chennai's metropolitan planning area, so check whether the project has the right planning permissions. Past projects. Visit completed developments if you can. Check construction quality and maintenance. Location. Check access to railway stations, bus routes, schools, and hospitals. Full cost. Add up registration, taxes, maintenance, and other charges beyond the base price. The agreement. Review the sale agreement carefully. Consider legal advice for larger purchases. Connectivity. Focus on existing transport links rather than relying only on proposed future infrastructure. Doing this small bit of homework can save you a lot of trouble later. Why New Projects in Ambattur Deserve a Closer Look Ambattur continues to see steady development, from ready-to-move homes to newer under-construction projects. Recent activity includes Voora Tech Edge, launched in 2025, along with newer residential projects registered under Tamil Nadu RERA. Always distinguish between a genuinely new launch, an under-construction project, and an older property being resold. Check the regulatory records and construction status directly before booking. Final Thoughts Ambattur has grown into an important residential and employment-linked market in western Chennai. VGN Projects Estates, Casagrand, and RWD bring established histories and larger project portfolios to the area. Voora Property Developers, G Square Housing, Sree Guru Foundations, and GP Homes add more choices across homes, plots, and commercial spaces. Nature Residences Development and Cinnamon Homes round out the list with newer, smaller local projects. This list is a good place to start if you are exploring real estate in Ambattur. But no list can pick the perfect home for you. Always check the RERA status, legal papers, location, and price. Visit the site. Ask questions. A little research today can help you make a smart choice tomorrow. Disclaimer: This ranking is for general information only. It is based on publicly available facts. Rankings may change based on new data and methods. Please do your own research before making any real estate or investment decision. Enjoyed this blog article? Visit PropTech Pulse for more interesting blogs.
PropTech Pulse Editorial
17th September 2026

Uncategorized
Builders in Siliguri 2026: Real Estate Companies to Know
Siliguri is one of North Bengal's most important cities. It connects West Bengal to Sikkim, the Northeast, and neighboring countries. This role has made Siliguri a strong center for trade, logistics, tourism, education, and services, which in turn supports steady housing demand. Buyers here can find apartments, townships, villas, and commercial buildings across areas like Matigara, Sevoke Road, Dagapur, and Champasari. Choosing a builder takes more than comparing ads. Check location, construction quality, and total cost carefully. In this guide, we will look at the top builders in Siliguri. How We Picked These Companies There is no official government list for this. So we used a simple method. We looked at: How many years the company has worked How active it is across Siliguri What kinds of projects it builds Its presence in trusted listings and West Bengal RERA records Public facts, where available This list is a guide, not an investment tip. The Top 10 Builders in Siliguri 1. PRM Begraj Group Works in: Uttorayon, Jyoti Nagar, Dagapur, Sevoke Road, Salugara Builds: Homes and offices PRM Begraj Group started in 1990 and says it has developed more than 3 million square feet across 35-plus properties. Its wide spread across Siliguri makes it a strong name to start your research with. Always evaluate each project independently, based on location and current construction status. 2. SandeepG Real Estate Works in: Shivmandir, Jyoti Nagar Builds: Homes and offices SandeepG Real Estate started in 2004 and says it has delivered more than half a million square feet of space. Its projects include Mayfair Utsav in Shivmandir and Mayfair Residency in Jyoti Nagar. The company also has upcoming projects, so check the current development stage of any specific property. 3. Panchnai Group Works in: Punjabi Para, Dagapur, Shivmandir, Amberdhura, Champasari Builds: Homes Panchnai Group started in 2005 and has a wide portfolio across the city. Its projects include Panchnai Aura and Panchnai Sanskritam, offering 2 and 3 BHK apartments as well as larger sizes. This makes it a solid name for buyers specifically looking for 2 or 3 BHK flats in Siliguri. 4. SBM Group Works in: Champasari, Ranidanga, Sevoke Road, Devidanga, Salugara Builds: Homes SBM Group has one of the widest project spreads in this list, with developments across many Siliguri neighborhoods. Its projects cover 1, 2, 3, and 4 BHK configurations, giving buyers a lot of choice. Compare carpet area, location, and total cost carefully across its different projects. 5. Way Win Consultants Works in: North Bharat Nagar, Hakimpara, Dabgram, near Bidhan Market Builds: Homes and offices Way Win Consultants started in 2003 and has completed multiple residential and commercial projects. Its projects include Shantiniketan, Way Win Gitanjali, and Way Win Landmark. This diverse portfolio makes it worth comparing when researching established developers in the city. 6. Mega Developers Works in: Siliguri Builds: Homes and offices Mega Developers has more than a decade of experience in residential and commercial construction. Its projects include Krishna Heights, Platina, and Windsor Park. Always examine each development separately, especially its location and construction stage. 7. Green Hill Group Works in: Mother Teresa Road, South Babupara, Sevoke Road, Iskcon Road, Matigara Builds: Homes Green Hill Group started in 2010 and says it has delivered more than 300,000 square feet of space, with more underway. Its projects include Green Retreat, Green Delight, and Green Elegance, spanning 1 to 4 BHK homes. This makes it relevant for buyers looking at both established and newer parts of the city. 8. Shristi Corp Works in: Siliguri Builds: Homes and mixed-use projects Shristi Corp is a larger company with projects across multiple parts of India, including a major integrated township in Siliguri. Large developments like this can offer planned infrastructure and shared facilities. Still, always evaluate the specific residential phase, possession timeline, and maintenance structure before deciding. 9. Jindal Constructions Works in: Siliguri Municipal Corporation area Builds: Homes Jindal Constructions is officially registered with West Bengal RERA as a promoter for a residential project in the city. Since newer developers can have a shorter public track record, place extra emphasis on documentation and regulatory disclosures. 10. Manokamana Developers Works in: Sevoke Road, Jyoti Nagar Builds: Homes Manokamana Developers is officially registered with West Bengal RERA as the promoter of residential projects in the city. This makes it worth including alongside other regional builders when researching local developers. Project-level research matters even more with newer developments, so verify regulatory information carefully. How We Ranked These Companies We did not use brand fame alone to rank these builders. Experience mattered a lot. We wanted companies with a real, confirmed history in Siliguri. Local presence was checked too. We wanted builders genuinely active across the city's different neighborhoods. Public information, including West Bengal RERA records where available, helped confirm the facts we could verify. Because of this method, our list may differ from other lists online. That is normal, since different methods lead to different results. Where to Buy: Key Areas in Siliguri Sevoke Road is an important commercial and residential corridor, connecting Siliguri to surrounding destinations. Matigara has grown into a key residential area, close to schools, hospitals, and major roads. Dagapur is well-established, with good access to central Siliguri and a mix of new and existing homes. Salugara sits along the Sevoke Road corridor, offering an alternative to the busier central areas. Champasari has established apartment projects, including several from SBM Group. Shivmandir is growing steadily, located along the route toward Matigara. North Bharat Nagar is established too, home to several Way Win Consultants projects. Types of Homes Available in Siliguri 2 BHK flats suit small families, professionals, and first-time buyers, common across both established and developing areas. 3 BHK flats suit bigger families needing more space. Compare carpet area, since usable space can vary a lot between similarly labeled homes. 4 BHK and premium homes offer more space and privacy but usually come with higher maintenance costs. Villas and independent homes are available in Siliguri's outskirts. Always verify land ownership and development permissions first. Commercial property is in demand too, given Siliguri's role as a trade gateway to North Bengal. Consider footfall and tenant demand before investing. What to Check Before Choosing a Builder Being on this list does not mean every project is perfect. Always check the details yourself. Here is a simple checklist: WBRERA registration. Check the official West Bengal portal for promoter details and project status. Past projects. Visit completed buildings if you can. Talk to residents about construction quality and maintenance. Location. Check access to schools, hospitals, workplaces, and major roads. Construction quality. Inspect materials, common areas, and parking where possible. Full cost. Add up registration, taxes, maintenance, and other charges beyond the base price. Documents. Review the sale agreement, title documents, and approvals carefully. Consider legal advice for larger purchases. Connectivity. Focus on existing infrastructure first, and treat any proposed future projects as a bonus, not a guarantee. Doing this small bit of homework can save you a lot of trouble later. Why New Projects in Siliguri Deserve a Closer Look Siliguri keeps seeing new residential development across both established and expanding areas, including Don Bosco Colony and Jyoti Nagar. New projects continue getting registered with West Bengal RERA in these areas, giving buyers more options to explore. Local planning authorities also continue processing new building and land-use applications across the wider Siliguri-Jalpaiguri area. Still, don't choose a project only because it's new. Always check the regulatory status, promoter details, and construction schedule first. Final Thoughts Siliguri has a strong mix of established local developers, each with a long track record in the city. PRM Begraj Group, SandeepG Real Estate, and Panchnai Group bring decades of combined experience. SBM Group, Way Win Consultants, Mega Developers, and Green Hill Group add more choices across different neighborhoods and home sizes. Shristi Corp, Jindal Constructions, and Manokamana Developers round out the list, spanning larger townships and newer local projects. This list is a good place to start if you are exploring real estate in Siliguri. But no list can pick the perfect home for you. Always check the RERA status, legal papers, location, and price. Visit the site. Ask questions. A little research today can help you make a smart choice tomorrow. Disclaimer: This ranking is for general information only. It is based on publicly available facts. Rankings may change based on new data and methods. Please do your own research before making any real estate or investment decision. Enjoyed this blog article? Visit PropTech Pulse for more interesting blogs.
PropTech Pulse Editorial
16th September 2026
Uncategorized
Builders in Dindigul 2026: Homes Built for Modern Living
Dindigul is an important city and district in southern Tamil Nadu. Its market covers land plots, independent homes, apartments, villas, and commercial properties. The district also includes well-known towns like Palani, Batlagundu, Oddanchatram, and Kodaikanal, giving buyers a lot of choice beyond just Dindigul city. Land and plotted developments are a big part of this market, more so than in many other Tamil Nadu cities. Choosing a builder takes more than comparing brand names. Always check location, title, approvals, and construction quality. In this guide, we will look at the top builders in Dindigul. How We Picked These Companies There is no official government list for this. So we used a simple method. We looked at: How active the company is across Dindigul district What kinds of projects it builds Its presence in trusted property listings and TNRERA records Public facts, where available This list is a guide, not an investment tip. The Top 10 Builders in Dindigul 1. VR Builders Works in: Nallampatty, Seelapadi, Chettinayakampatti, Thadikombu, Kodaikanal Builds: Homes, villas, and land plots VR Builders is based in Dindigul, with an office in R.M. Colony. Its portfolio spans independent houses, villas, and land across several parts of the district. This makes it a good name for buyers looking beyond apartments, toward independent homes or land. 2. G Square Housing Works in: Ponnagaram, Dindigul Builds: Land plots G Square Housing focuses mainly on plotted development across South India, including a project called G Square Blue Hills in Ponnagaram. This makes it a good option for buyers who want to purchase land and build their own home later. Always verify layout approval, title, and utility infrastructure before buying a plot. 3. V City Developers Works in: Batlagundu Builds: Land plots V City Developers has two projects, V City Kodai Grand Legacy and V City Kodai Vels Garden, both in Batlagundu. One sits along the Batlagundu-Kodaikanal road, making it relevant for buyers considering the route toward Kodaikanal. 4. Casagrand Works in: Pallangi, Kodaikanal Builds: Land plots Casagrand is a major Chennai-based developer with a wider presence across Tamil Nadu. Its Dindigul district projects include Casagrand The Hilltop Phase 1 and Casagrand Hillmont, both plotted developments in Kodaikanal. Always assess the specific project rather than assuming the company's broader reputation applies equally everywhere. 5. Mani Property Developers Works in: Vadamadurai, Dindigul Builds: Land plots Mani Property Developers is headquartered in Karur and also works across Tiruchirappalli, Coimbatore, and Dindigul. It has residential plot offerings in Vadamadurai. This makes it relevant for buyers researching property in the wider Dindigul district, not just the city center. 6. Dream Properties Kovai Works in: Oddanchatram Builds: Homes and land Dream Properties Kovai is based in Coimbatore but has property activity in Oddanchatram, in western Dindigul district. The company describes its work as covering planning, design, construction, and marketing of real estate. Always check the exact location and ownership documentation for any specific property. 7. LandHub Properties Works in: Chinnalapatti, Dindigul Builds: Land and property services LandHub Properties is based in Tiruchirappalli and lists Dindigul among the areas it serves, including activity around Chinnalapatti. The key focus should always be the individual property and its documentation, not just the company name. 8. Shri Anugrahaa Homes Works in: Vilpatti, Kodaikanal Builds: Land plots Shri Anugrahaa Homes has a plotted project called Shri Anugrahaa Heavenly Haven Plots in Vilpatti. This makes it relevant for buyers interested in land around Kodaikanal and the hill-station market. Kodaikanal properties need extra checks on terrain, road access, and water availability. 9. Elephantine Enterprises Works in: Moonjikal, Kodaikanal Builds: Land plots Elephantine Enterprises started in 2013 and works across Chennai, Kodaikanal, and Dindigul. Its project, Elephantine Tales in Moonjikal, is a large plotted development in the district. Always examine title, land use, and access carefully for Kodaikanal land. 10. Sowrem Promoters Works in: Kodaikanal, Dindigul district Builds: Land plots and villas Sowrem Promoters started in 2012 and has a project called Onyx Paradise, offering residential plots and villas in Kodaikanal. The company says the project has DTCP approval and RERA registration. Check the exact location, terrain, and documentation carefully before investing in hill-station property like this. How We Ranked These Companies We did not use brand fame alone to rank these builders. Local presence mattered a lot. We wanted companies genuinely active across Dindigul district, including its smaller towns. Listing activity was checked too. We looked at how often each builder appeared in trusted property listings. Project variety was another factor, including homes, villas, and land plots. Public information helped confirm what facts we could verify. Because of this method, our list may differ from other lists online. That is normal, since different methods lead to different results. Where to Buy: Key Areas in Dindigul Dindigul city is the district's main urban center, with established neighborhoods, schools, and hospitals. Palani is a well-known town, supported by tourism, religious travel, and local commerce. Batlagundu sits strategically on the route toward Kodaikanal, popular for plotted development. Oddanchatram is an important commercial and agricultural center, home to activity from Dream Properties Kovai. Nilakottai is another established town, with a mix of independent houses and plotted developments. Kodaikanal is its own distinct property market, attracting interest in villas, plots, and holiday homes. Several developers, including Casagrand and Sowrem Promoters, are active here. Since the terrain and environment are different from the plains, always do extra checks before buying land here. Types of Homes Available in Dindigul 2 BHK flats suit small families and first-time buyers, though apartments are just one part of this market. Check carpet area and maintenance before deciding. 3 BHK flats suit bigger families, though availability varies a lot between Dindigul city and smaller towns. Compare actual usable area, not just the advertised size. Residential plots are a big part of the local market, spread across Dindigul city, Batlagundu, Palani, and other towns. Always verify title, layout approval, and utility access. Independent houses and villas offer more privacy than apartments. Check both land documents and building approvals before buying. Commercial property is in demand too, thanks to Dindigul's role as a business center. Check visibility, access, and tenant demand before investing. What to Check Before Choosing a Builder Being on this list does not mean every project is perfect. Always check the details yourself. Here is a simple checklist: TNRERA registration. Check the official portal for promoter and project details. Land and layout documents. Especially important for plots. Verify ownership, layout approval, and road access. Location. Check proximity to schools, hospitals, and major roads. For Kodaikanal, also check terrain and road conditions. Site inspection. For finished homes, inspect the building yourself. For under-construction ones, compare actual progress with what's registered. Full cost. Add up registration, taxes, maintenance, and other charges beyond the base price. The agreement. Read the sale agreement and property documents carefully. Get legal advice for larger purchases. Doing this small bit of homework can save you a lot of trouble later. Why New Projects in Dindigul Deserve a Closer Look Dindigul district continues to see new property registrations, spanning both residential buildings and plotted layouts across areas like Palani, Athoor, and Oddanchatram. Builders like V City Developers, G Square Housing, Casagrand, and Elephantine Enterprises all have active projects across the district and Kodaikanal. Always tell the difference between a genuinely new launch, an under-construction project, and an older property being resold. Check regulatory records before making a booking. Final Thoughts Dindigul has a wide mix of local and regional builders, with a strong focus on land and plotted development. VR Builders, G Square Housing, and V City Developers bring solid local and regional experience. Casagrand, Mani Property Developers, and Dream Properties Kovai add more choices across the wider district. LandHub Properties, Shri Anugrahaa Homes, Elephantine Enterprises, and Sowrem Promoters round out the list, mostly focused on Kodaikanal's land market. This list is a good place to start if you are exploring real estate in Dindigul. But no list can pick the perfect home for you. Always check the RERA status, legal papers, location, and price. Visit the site. Ask questions. A little research today can help you make a smart choice tomorrow. Disclaimer: This ranking is for general information only. It is based on publicly available facts. Rankings may change based on new data and methods. Please do your own research before making any real estate or investment decision. Enjoyed this blog article? Visit PropTech Pulse for more interesting blogs.
PropTech Pulse Editorial
17th September 2026
Uncategorized
Builders in Ambattur 2026: Homes Built to Last
Ambattur is an established area in western Chennai, known for both its residential neighborhoods and its industrial roots. Its location gives easy access to Padi, Mogappair, Anna Nagar, Avadi, and Korattur, making it a popular choice for both homebuyers and investors. Buyers here can find apartments, land plots, villas, and commercial spaces. Choosing a builder takes more than checking company names. Always look at location, construction quality, and total cost. In this guide, we will look at the top builders in Ambattur. How We Picked These Companies There is no official government list for this. So we used a simple method. We looked at: How active the company is in and around Ambattur What kinds of projects it builds Its presence in trusted property listings and TNRERA records Public facts, where available This list is a guide, not an investment tip. The Top 10 Builders in Ambattur 1. VGN Projects Estates Works in: Ambattur Builds: Homes and land plots VGN Projects Estates is an established Chennai developer with a strong Ambattur history. Its project, VGN Brent Park, is a CMDA-approved plotted development covering 9.52 acres with 204 plots. This makes VGN a good name for buyers comparing established developers who offer both plots and homes. 2. Casagrand Works in: Near Mogappair Builds: Homes Casagrand is one of Chennai's established residential developers, with a completed project called Casagrand Athens near Ambattur and Mogappair, offering 2 BHK apartments across 953 units. The company also has two newer projects, Casagrand Linore and Casagrand Ventra, serving the Ambattur area. This gives buyers a mix of finished and new options from the same builder. 3. RWD Works in: Ambattur Builds: Homes and offices RWD has more than 15 years of experience and says it has completed over 13.5 million square feet of development. Its project, RWD Lemongraz, is a residential development directly in Ambattur. This makes RWD worth checking for buyers who want an established apartment community. 4. Voora Property Developers Works in: Ambattur Builds: Offices Voora Property Developers started in 1995 as a family-run business. Its project, Voora Tech Edge, is a commercial development positioned as a premium office space in Ambattur. This makes Voora a good pick for investors wanting commercial property rather than homes. 5. G Square Housing Works in: Ambattur and other parts of Chennai Builds: Land plots G Square Housing focuses mainly on plotted developments across Chennai and Tamil Nadu. The company has activity linked to the broader Ambattur plotted market. For plots, always check the title, land use, approvals, and road access before buying. 6. Sree Guru Foundations Works in: Ambattur Builds: Homes Sree Guru Foundations has a residential project called Sree Guru Pragathi, offering 3 BHK homes and currently ready to move in. This makes it relevant for buyers specifically looking for larger apartments in Ambattur. For smaller, local builders like this, check their finished projects and promoter details closely. 7. GP Homes Works in: Ambattur Builds: Homes GP Homes has two projects in Ambattur: GP Fern Breeze and GP Homes Fern Breeze Diamond, offering 2 and 3 BHK homes. Compare carpet area, location, and amenities across its projects before deciding. 8. Local Plotted Developers Works in: Ambattur Builds: Land plots Beyond the bigger names, Ambattur also has smaller local promoters offering plotted developments alongside established names like G Square Housing. For plots, a developer's experience is only part of the picture. Always check land title, drainage, water access, and electricity connections directly. 9. Nature Residences Development Works in: Vanagaram-Ambattur Road Builds: Homes Nature Residences Development has a project called AYANA, offering 185 homes and currently under construction, with CMDA approval on record. For under-construction homes like this, check the registered project details, construction progress, and expected finish date. 10. Cinnamon Homes Works in: Mogappair, within the wider Ambattur zone Builds: Homes Cinnamon Homes has a smaller residential project in Mogappair, officially registered with Tamil Nadu RERA, with 20 homes. For smaller developers like this, focus on project-specific verification rather than relying on brand familiarity alone. How We Ranked These Companies We did not use brand fame alone to rank these builders. Local presence mattered a lot. We wanted companies genuinely active in and around Ambattur. Listing activity was checked too. We looked at how often each builder appeared in trusted property directories and TNRERA records. Project variety was another factor, including homes, offices, and land plots. Public information helped confirm what facts we could verify. Because of this method, our list may differ from other lists online. That is normal, since different methods lead to different results. Where to Buy: Key Areas in Ambattur Ambattur OT is one of the area's established parts, with good access to buses, shops, and schools. The Ambattur Industrial Estate is a key employment hub, supporting steady rental and housing demand nearby. Menambedu offers apartments and independent homes within the wider western Chennai residential belt. Athipattu has seen newer development along the Vanagaram-Ambattur Road, including larger apartment projects. Mogappair is a major nearby market, with established housing, schools, and healthcare facilities. Korattur offers good railway connectivity and sits close to Ambattur, Padi, and Anna Nagar. Types of Homes Available in Ambattur 2 BHK flats suit small families, professionals, and first-time buyers. Check carpet area and maintenance charges, not just the price. 3 BHK flats suit bigger families needing more space. Compare actual room dimensions, since usable space can vary between similarly sized homes. Land plots are common here too, including projects like VGN Brent Park. Always verify title, approvals, and access roads before buying. Villas and independent homes are more common in the outer parts of the Ambattur-Avadi belt. Check land ownership and construction quality carefully. Commercial property is in demand thanks to Ambattur's industrial base. Voora Tech Edge is one current example. Always check accessibility and tenant demand before investing. What to Check Before Choosing a Builder Being on this list does not mean every project is perfect. Always check the details yourself. Here is a simple checklist: TNRERA registration. Check the official portal for promoter details, project status, and approvals. CMDA approvals. Ambattur falls within Chennai's metropolitan planning area, so check whether the project has the right planning permissions. Past projects. Visit completed developments if you can. Check construction quality and maintenance. Location. Check access to railway stations, bus routes, schools, and hospitals. Full cost. Add up registration, taxes, maintenance, and other charges beyond the base price. The agreement. Review the sale agreement carefully. Consider legal advice for larger purchases. Connectivity. Focus on existing transport links rather than relying only on proposed future infrastructure. Doing this small bit of homework can save you a lot of trouble later. Why New Projects in Ambattur Deserve a Closer Look Ambattur continues to see steady development, from ready-to-move homes to newer under-construction projects. Recent activity includes Voora Tech Edge, launched in 2025, along with newer residential projects registered under Tamil Nadu RERA. Always distinguish between a genuinely new launch, an under-construction project, and an older property being resold. Check the regulatory records and construction status directly before booking. Final Thoughts Ambattur has grown into an important residential and employment-linked market in western Chennai. VGN Projects Estates, Casagrand, and RWD bring established histories and larger project portfolios to the area. Voora Property Developers, G Square Housing, Sree Guru Foundations, and GP Homes add more choices across homes, plots, and commercial spaces. Nature Residences Development and Cinnamon Homes round out the list with newer, smaller local projects. This list is a good place to start if you are exploring real estate in Ambattur. But no list can pick the perfect home for you. Always check the RERA status, legal papers, location, and price. Visit the site. Ask questions. A little research today can help you make a smart choice tomorrow. Disclaimer: This ranking is for general information only. It is based on publicly available facts. Rankings may change based on new data and methods. Please do your own research before making any real estate or investment decision. Enjoyed this blog article? Visit PropTech Pulse for more interesting blogs.
PropTech Pulse Editorial
17th September 2026

Ask Pulse Ai anything about real estate

Unlock the Latest in Real Estate
News, Infographics, Blogs & More! Delivered to your inbox.