New Launch - India Real Estate Report 2026.

Services
Knowledge Hub
Resources
Tools

Ask Pulse Ai
©PropTech Pulse 2025, All rights reserved.


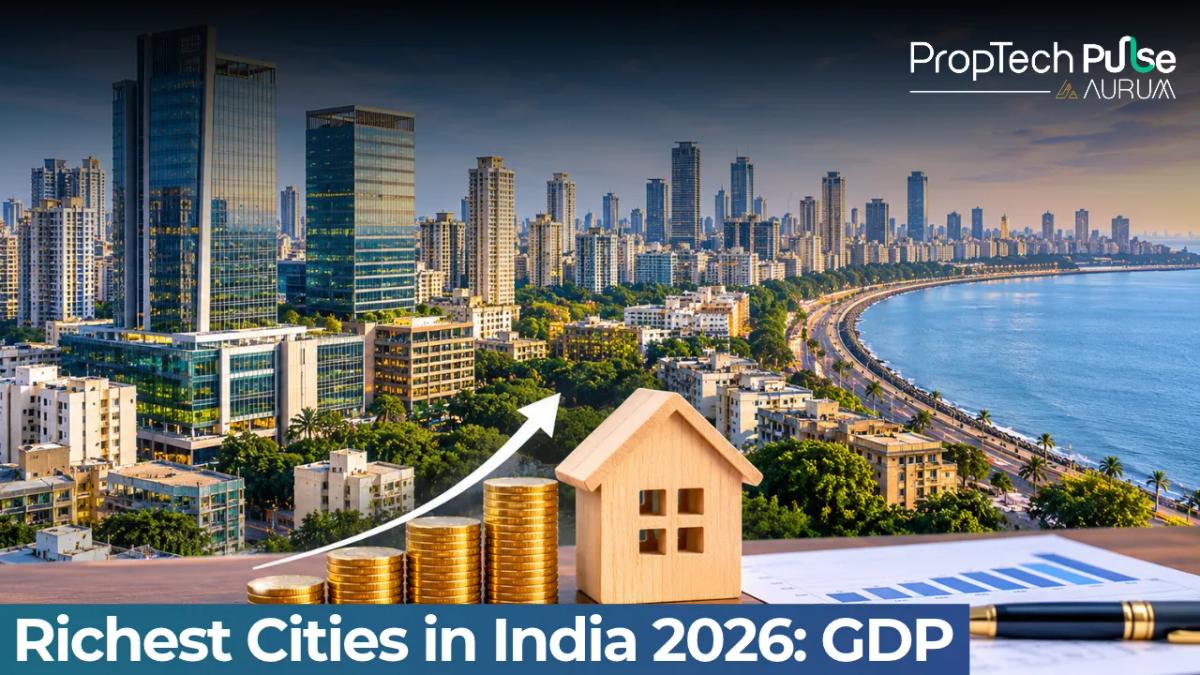
Mumbai carries the highest economic output of any urban centre in the country, making it the richest city in India by nominal gross domestic product. Delhi National Capital Region holds second place.
These two metros alone account for more than twenty five percent of national corporate tax revenue and drive the bulk of financial services, media and technology employment.
Headline numbers look impressive. They do not tell a buyer which neighbourhood offers genuine rental stability or realistic entry pricing.
This guide breaks down the top 10 cities in India by GDP, explains how those figures are calculated, and maps each city's dominant industries to actual property types.
You will also find guidance on navigating affordability traps and picking corridors that match your budget.
The Richest City in India: Top 10 Cities by GDP Ranked
Quick answer
Mumbai is the richest city in India by nominal GDP, generating over $310 billion in annual economic output. Corporate wealth concentrates in financial and technology hubs. Genuine residential investing depends on tracking transit expansions, verifying municipal master plans and comparing local EMI costs against rental yields rather than chasing headline rankings.
The ranking of metropolitan economies shifts slightly depending on whether analysts use purchasing power parity or current market exchange rates.
The following table consolidates recent private forecasts alongside official state economic surveys to give you a consistent baseline.
| Rank | City | Nominal GDP (USD) | Core Industries | Infrastructure Triggers | Real Estate Implication |
|---|---|---|---|---|---|
| 1 | Mumbai | $310B+ | Financial and professional services | Metro Line 3 and Coastal Road | High commercial demand; premium residential saturation pushes buyers to Thane and Navi Mumbai |
| 2 | Delhi NCR | $294B | Governance, IT and retail | Rapid Metro expansion | Strong rental yield from student and migrant workforce clusters across satellite towns |
| 3 | Kolkata | $150B | Services and trade | Green Line metro extension | Undervalued assets with high correction potential and stable old money demand |
| 4 | Bengaluru | $110B | Technology and biotech | Outer Ring Road widening | Extreme supply demand imbalance drives perpetual appreciation in tech corridors |
| 5 | Chennai | $78B | Manufacturing and automotive | Outer Ring Road integration | Consistent industrial leasing supports steady commercial valuations and mid income housing |
| 6 | Hyderabad | $75B | Pharmaceuticals and IT | Metro phases 2 and 3 | Balanced growth between Hi Tech City and Cyberabad sustains steady rental markets |
| 7 | Pune | $69B | Education and IT | Airport expansion projects | Strong demand from students and engineers keeps ready to move inventory tight |
| 8 | Ahmedabad | $68B | Textiles and diamonds | Dedicated Freight Corridor | Growing logistics parks and affordable gated communities around ring roads |
| 9 | Surat | $60B | Diamond processing and textiles | Surat Metro Phase 1 | Local investors frequently buy standalone plots and high rise apartments |
| 10 | Visakhapatnam | $43B | Ports and defence manufacturing | Vizag Smart City initiatives | Early entry prices and government housing scheme eligibility attract long term holders |
Budget definition matters. Private forecasting firms use different administrative boundaries when calculating GDP. Some include entire satellite towns while others limit data to municipal corporations. Always confirm whether a projected figure covers your exact target neighbourhood.
How City GDP is Measured and Why It Doesn't Dictate Buying Power
Indian metropolitan economies are not measured by a single central government unit. The Ministry of Statistics and Programme Implementation publishes data at the state level, not the city level.
Analysts therefore blend district level income data, commercial turnover reports and corporate tax contributions to build a working estimate.
This methodology creates a gap between aggregate wealth and individual purchasing power. A city might host a massive financial hub while the surrounding residential zones rely heavily on service sector wages.
When average incomes lag behind median apartment prices, the market becomes an affordability trap.
Investors must separate the corporate balance sheet from the tenant salary packet.
You can own a premium tower adjacent to a multinational headquarters and still struggle to find white collar tenants who qualify for a home loan at current interest rates.
Calculating expected rental yields against prevailing EMI costs protects you from overleveraging during market peaks.
Read our guide on understanding rental yields before committing capital to a high profile address. Run quick vacancy scenarios using our rental yield calculator to stress test projected cash flows.
Mapping Economic Engines to Real Estate Demand
Each top ranked city runs on a distinct economic engine. That engine dictates the type of housing people actually rent or buy, and it shapes long term land value.
Mumbai's financial and professional services cluster pulls in bankers, lawyers and compliance officers who prefer low commute times.
This concentrates demand in the Western suburbs and South Mumbai, leaving newer precincts like Thane and Navi Mumbai to absorb overflow buyers.
Properties near established business districts command a longevity premium because they retain liquidity even during slowdowns.
Delhi NCR operates differently. Governance, retail and layered IT ecosystems distribute demand across multiple satellites.
Gurugram's cyber hubs create intense micro market spikes that cool quickly when new supply hits the register. Faridabad and Ghaziabad offer cheaper entry points for families willing to trade shorter commutes for larger carpet areas.
Bengaluru's technology and biotechnology dominance has created a linear demand pattern along the Outer Ring Road.
Employment corridors like Whitefield and Electronic City drive permanent structural shortage of quality rental stock.
Buyers who invest in these pockets often face stiff competition from NRIs and returning professionals during boom cycles.
Chennai and Hyderabad balance their growth across manufacturing, pharmaceuticals and IT. Their diversified industrial bases protect residential values from sector specific downturns.
Commercial leasing activity remains stable, supporting mid segment housing developments near office complexes. Understanding rental yields helps you gauge whether a diversified city delivers better passive returns than a tech heavy hub.
Affordability Traps and Micro-Market Selection
Highest economic output does not guarantee easy homeownership. Entry pricing frequently outpaces average salary growth in the most prosperous metros.
A typical young professional relocating to Bengaluru might discover that prime locations in Koramangala or Indiranagar require a deposit that wipes out emergency savings. Consider a ₹1.2 crore apartment.
An 8.5% interest rate over twenty years puts the monthly EMI at around ₹10.50 lakh annually.
Comparable rented flats in the same micro market command ₹60,000 per month, totalling ₹7.20 lakh annually. The math favours renting until local salaries catch up to bank lending limits.
You can sidestep these traps by anchoring your search to transit announcements rather than current builder marketing.
Infrastructure projects like dedicated freight corridors or extended metro lines physically reshape the usable geography of a city.
Land values react three to four years before the project completes.
Track the Public Works Department schedules and municipality master plans alongside standard listing platforms. Pair this physical planning data with mortgage readiness checks. Running a check on a home loan eligibility calculator reveals your true borrowing capacity before you shortlist properties outside your price bracket.
Context: The Richest State in India and Intra-State Disparities
Maharashtra consistently ranks as the richest state in India by total gross state value added.
The state's economy is heavily concentrated in its western districts. Urban agglomerations like Mumbai and Pune contribute disproportionately compared to rural hinterlands.
This concentration creates sharp internal disparities. A developer pricing a luxury project in Bandra works with completely different risk models and land cost structures than a builder launching townships in Wardha.
Regional variations in stamp duty, local body taxes and floor space index rules compound these differences.
When evaluating regional opportunity, compare the state aggregate against district level performance.
Look for states where wealth distribution supports broad based construction activity rather than isolated premium enclaves.
Telangana and Karnataka follow similar patterns, clustering advanced services in state capitals while agricultural zones lag.
Cross border commuters in these regions drive continuous demand for transitional housing belts.
Quick Decision Matrix for Investors
Move through these filters before booking site visits. The sequence prevents emotional decisions driven by headline rankings or sales presentations.
Check the dominant industry cycle. Are local employers expanding headcount or reducing workforces over the last four quarters? Hiring freezes kill rental demand within eighteen months.
Map your required return against local vacancy rates. Empty units destroy compound interest calculations.
Consult the latest RBI housing price indices and state registration data for baseline absorption metrics.
Verify municipal transit timelines. A proposed station sounds promising until you check the ground survey delays and compensation disputes that routinely push completion dates back by two years.
Calculate your exit timeline. Residential properties require holding periods of five to seven years to smooth out transaction costs and realise meaningful gains above inflation. Shorter holds turn profitable looking assets into cash traps.
Frequently asked questions
Which is the richest city in India?
Mumbai currently holds the title for the richest city in India based on nominal gross domestic product estimates. Its financial services, media and corporate headquarters generate the highest aggregate economic output. Delhi National Capital Region follows closely in second place. These rankings measure total business activity rather than individual household wealth or housing affordability levels.
What are the top 10 cities in India by GDP?
The leading metropolitan economies rank sequentially starting with Mumbai and Delhi NCR. Kolkata and Bengaluru occupy the third and fourth positions due to heavy trading and information technology sectors. Chennai, Hyderabad, Pune, Ahmedabad, Surat and Visakhapatnam complete the top ten list. These figures combine private forecasts with district level income data from state economic surveys.
Is Mumbai the richest place in India?
Yes, Mumbai represents the richest place in India by total economic output. The city hosts the Reserve Bank of India, major stock exchanges and countless multinational corporate offices. This concentration of capital drives enormous commercial real estate valuations. However, extreme land scarcity and premium pricing mean that ordinary homebuyers rarely purchase property within the historic city boundaries.
What is the top 20 richest cities in India list usually expanded with?
Analysts typically extend the core top ten framework by adding emerging tier two centres like Jaipur, Lucknow, Coimbatore and Chandigarh. These cities show accelerating GDP growth driven by government infrastructure spending, educational institutions and logistics hubs. Their economic output remains smaller than the primary metros but grows faster due to lower existing baselines and expanding middle class consumption.
Which is the richest state in India?
Maharashtra stands as the richest state in India by total gross state value added. The western state generates significant revenue through Mumbai's financial sector and Pune's manufacturing belt. This wealth distribution is uneven, creating sharp disparities between highly urbanised coastal districts and slower growing agricultural interiors. Investors must track both state aggregates and specific municipal budgets.
Sources
- Reserve Bank of India: Regional office publications on state economic indicators (accessed November 2026)
- Ministry of Statistics and Programme Implementation: Gross Value Added at basic prices by district and state (accessed November 2026)
- Maharashtra State Government: Economic survey and municipal corporation budget documents (accessed November 2026)
- Government of Delhi: Economic survey and infrastructure development reports (accessed November 2026)
- Government of Tamil Nadu: Economic review and manufacturing investment statistics (accessed November 2026)
Enjoyed this blog article? Visit PropTech Pulse for more interesting blogs.




Ask Pulse Ai anything about real estate

Unlock the Latest in Real Estate
News, Infographics, Blogs & More! Delivered to your inbox.