New Launch - India Real Estate Report 2026.

Services
Knowledge Hub
Resources
Tools

Ask Pulse Ai
©PropTech Pulse 2025, All rights reserved.


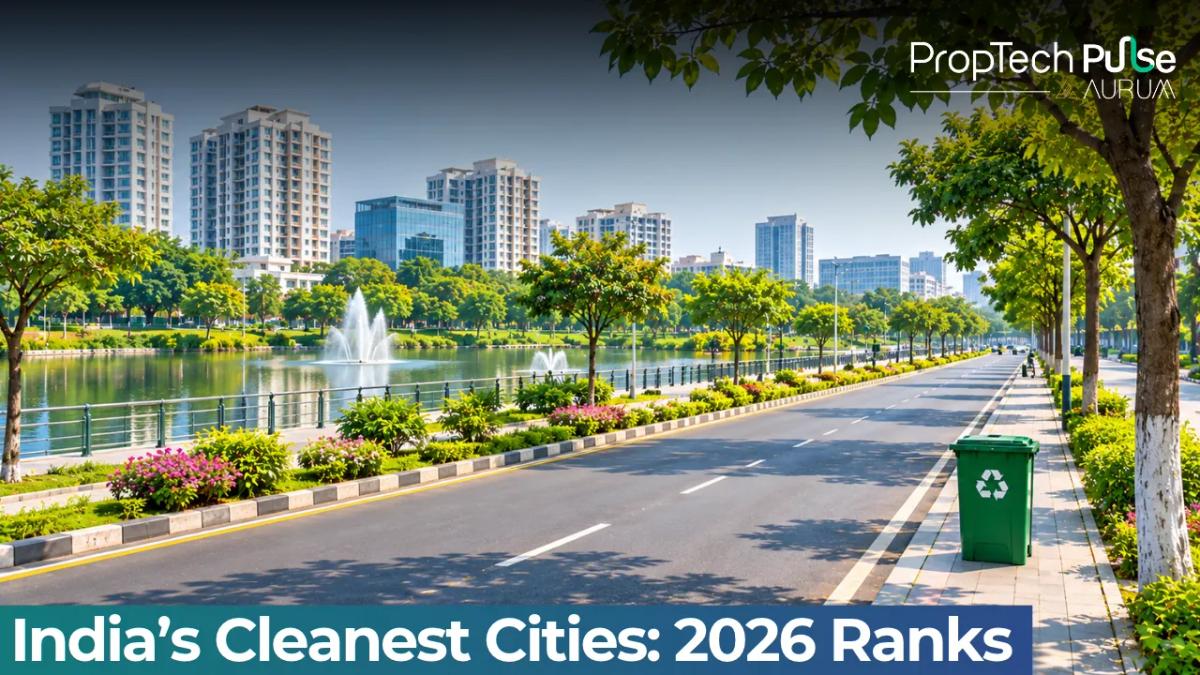
The phrase "cleanest city in India" sounds appealing on paper, but it rarely translates to perfectly sanitized streets outside your specific housing complex. Swachh Survekshan tracks municipality-wide averages.
A top ranking rewards central solid waste plants and ward-level compliance, not necessarily the garbage bins on every corner.
For homebuyers and investors, the headline score tells you less than the reality of municipal maintenance budgets, property appreciation trends, and rental demand. Here is how the rankings actually impact real estate decisions.
Which Is the Cleanest City in India According to Swachh Survekshan?
Quick answer
Indore holds the title for the cleanest city in India for eight consecutive years under the Swachh Survekshan 2024–25 survey conducted by the Ministry of Housing and Urban Affairs.
Indore maintains the top spot following intensive door-to-door waste segregation and continuous upgrading of biological treatment facilities.
Surat secured second place by expanding sewage treatment capacity alongside strict enforcement of plastic bans. Navi Mumbai used planned sector layouts to standardize garbage collection across rapidly developing residential blocks.
Vijayawada scored heavily on visible hygiene execution in commercial corridors. The remaining top cities consistently deliver strong marks for public toilet maintenance, IT-enabled grievance redressal, and waste-to-energy initiatives.
These rankings split into distinct brackets based on population size. Winners in municipalities exceeding ten lakh residents operate on completely different infrastructure scales than those ranked in smaller town categories.
You must understand this league breakdown before comparing any relocation zones.
It stops you from evaluating a district headquarters against a metro corridor like Delhi or Mumbai. Investors treat both categories as separate universes. Rental dynamics and developer competition differ sharply between the two tiers.
Breaking Down the Super Swachh League vs Population Brackets
The evaluation model separates entries to keep assessments fair. Super Swachh targets large metropolitan areas requiring massive solid waste processing capacity.
Population bracket leagues evaluate mid-sized towns where civic boundaries are tighter and responses move faster.
A city dominating the Super Swachh table usually wins on scientific waste processing plants, mechanized sweeping fleets, and centralized sanitation networks.
Ranking high in smaller brackets rewards rapid complaint resolution, efficient door-to-door segregation programs, and strong community participation.
Current Standings: Indore, Surat, Navi Mumbai, Vijayawada, and the Next Five
Indore maintained its streak through intensive door-to-door waste segregation and continuous upgrading of biological treatment facilities.
Surat secured its position by expanding sewage treatment capacity alongside strict enforcement of plastic bans. Navi Mumbai used planned sector layouts to standardize garbage collection protocols across rapidly developing residential blocks.
Vijayawada scored heavily on visible hygiene execution in commercial corridors.
The remaining top cities consistently deliver strong marks for public toilet maintenance, IT-enabled grievance redressal, and waste-to-energy initiatives.
Visit our guide on the 10 best cities to invest in real estate in India 2025 for broader market context before narrowing down a relocation zone.
| City | Dominant Infrastructure Driver | Property Market Signal to Watch |
|---|---|---|
| Indore | Scientific waste processing and segregation | Rental yield stability in residential clusters |
| Surat | Sewerage network expansion and drainage upgrades | Construction cost premiums for green buildings |
| Navi Mumbai | Planned sector layout standardization | Institutional capital inflow into township projects |
| Vijayawada | Commercial corridor hygiene enforcement | Tenant retention spikes in mixed-use developments |
| Ahmedabad | Digital grievance resolution systems | Easing of regulatory compliance hurdles for builders |
How 'India Cleanest Cities' Are Rated: The 60 Percent Service Rule
Swachh Survekshan stopped treating cleanliness as a seasonal festival cleanup exercise. The scoring framework now targets permanent infrastructure and measurable service improvements.
Sixty percent of the total marks derive directly from service-level progress.
That slice splits across three mandatory components. Solid waste management carries thirty percent weightage. Sanitation and wastewater treatment claim twenty-two percent. Visible cleanliness assessments account for the final seventeen percent.
The remaining forty percent blends economic productivity metrics with citizen feedback.
Assessors from the Quality Council of India verify all inputs through geo-tagged photography, document audits, and ground interviews spanning forty-five days each cycle.
Over three thousand evaluators visited more than four thousand five hundred locations during the latest round. Public engagement contributed roughly nineteen crore data points through dedicated reporting apps and social media channels.
Waste Processing, Sanitation Pipes, and the 3R Shift
Recent evaluation cycles penalize dumping-heavy strategies and reward circular economy execution. The scoring rubric emphasizes reduce, reuse, and recycle principles applied at municipal scale.
Cities with documented composting units, biomethanation plants, and material recovery facilities score higher than those relying solely on landfill diversion.
This shift signals long-term civic commitment rather than cosmetic street washing. For developers, cleaner waterways and functioning drains translate directly into lower basement flooding risks and reduced foundation repair claims.
Municipal upgrades also tighten zoning around waste handling hubs. Plots situated near established processing sites become harder to repurpose later.
The Citizen Voice: Geo-tagging, Apps, and Ground Interviews
Citizen feedback now carries heavier weight than in previous iterations. Residents submit geotagged complaints regarding overflowing bins, blocked manholes, and broken street lighting via mobile interfaces.
Trained evaluators cross-reference app submissions with actual site conditions. High-resolution photos map problem areas onto digital ward charts. Interview panels rotate randomly to prevent lobbying.
This architecture forces municipalities to maintain baseline service levels continuously.
They cannot simply clean routes ahead of inspectors alone. Investors tracking tenant satisfaction notices benefit immensely when evaluating rental assets in these jurisdictions.
Read more about verifying approvals and project history by reviewing our property due diligence checklist for buyers to understand how local governance quality impacts developer accountability.
Top 10 Cleanest City in India: Where Civic Scores Meet Property Markets
When searching for the cleanest city in India, buyers often miss the micro-disparities hidden inside municipal averages.
High cleanliness indices correlate strongly with predictable rental yields and faster sales cycles.
Tenants prefer wards with reliable refuse removal, predictable drainage performance, and functional public amenities. Builders face rising expectations for eco-friendly construction methods when selling in these premium markets.
Buyers accept a sustainability premium knowing that municipal services will sustain property livability over decades.
Rental Stability and Builder Sustainability Premiums
Properties located in top-ranked wards demonstrate lower vacancy rates compared to peripheral zones with weaker civic infrastructure.
Tenant churn drops sharply when daily nuisance factors like litter accumulation, foul smells, and mosquito breeding disappear from the immediate neighbourhood.
Developers respond by integrating rainwater harvesting, solar power integration, and landscape preservation into proposals. Projects incorporating green building certifications command higher initial sale prices and attract institutional capital.
Commercial leases in award-winning cities carry longer lock-in periods. Businesses prioritize employee well-being and regulatory compliance.
Locality Reality: Municipal Averages Versus Ward-Level Gaps
A city-wide star rating masks severe micro-disparities inside specific wards. Municipal resources concentrate along main arterial roads, commercial hubs, and newly developed sectors.
Older residential pockets receive diluted attention and delayed upgrades. Homebuyers frequently discover that society-level waste management still requires private contracts despite stellar civic rankings.
Walk the proposed location during evening hours and late mornings before committing funds. Verify which ward administration manages the exact pin code. Check recent public grievance resolution timelines online.
Talk to current residents about drainage reliability during peak monsoon months. Compare projected asset growth using current rates and trends for Noida Amarpali Silicon City benchmarks alongside similar localities to isolate genuine appreciation from artificial scarcity.
Investigate whether specific townships require additional infrastructure levies. Look into projects like is Lucknow a good city for property investment now to gauge regional policy shifts affecting buyer demand.
Understand how planning corridors such as what is Yamuna Expressway Industrial City alter surrounding land value trajectories before relying purely on cleanliness metrics.
The Other End of the Spectrum: Top 10 Polluted Cities in India Context
Examining the pollution extreme provides necessary perspective when assessing environmental risk premiums.
Urban centres struggling with air quality degradation, solid waste mismanagement, and stagnant water bodies attract heavy penalties from environmental regulators.
These areas face deteriorating asset values over time. Properties near untreated discharge zones suffer accelerated structural wear. Tenant retention falls sharply in neighbourhoods lacking basic refuse collection services.
Comparing leadership versus lagging performers clarifies why certain municipal taxes increase while others stagnate. Governments redirect capital expenditure toward revitalization efforts.
This creates speculative opportunities for patient investors willing to absorb short-term inconvenience. Entry-level pricing discounts often fail to compensate for prolonged liquidity traps however.
Why Contrasting Extremes Helps You Grade Any Relocation Choice
Rankings exist on a continuum rather than binary outcomes. Recognizing where your target city sits between the cleanest and most polluted benchmarks prevents misplaced optimism or unwarranted fear.
Environmental degradation compounds financial loss through healthcare expenses, decreased work productivity, and forced relocation clauses. Superior civic execution reduces long-term holding costs.
Cross-referencing cleanliness data with employment centers, transport connectivity, and school accessibility builds a realistic living profile beyond superficial aesthetics.
Before You Book Based on a Green Ribbon
Use cleanliness awards as one filter among several, not as a standalone buying signal. Visit the specific ward during non-working hours. Inspect basement drainage infrastructure personally.
Confirm whether the nearest society relies on contracted private vendors or municipal services. Run projections using verified rates and trends for Noida Amarpali Silicon City models adjusted for local supply constraints.
Combine civic health checks with RERA registration verification, legal title clearance, builder reputation analysis, and yield calculations before signing agreements. A pristine municipal brand protects your lifestyle.
Rigorous due diligence safeguards your capital.
Frequently asked questions
Which city is currently recognized as the cleanest in India according to official government surveys?
Indore holds the primary position under the Swachh Survekshan 2024–25 rankings published by the Ministry of Housing and Urban Affairs. The city won the top spot in the population bracket exceeding ten lakh residents for the eighth consecutive cycle. Surat, Navi Mumbai, and Vijayawada occupy the subsequent positions. These rankings reflect sustained municipal investment in scientific waste processing, effective sewerage networks, and standardized door-to-door segregation protocols implemented across multiple administrative wards.
How does the government officially rank urban areas for cleanliness standards?
Evaluations run through a structured framework where sixty percent of total marks derive from verifiable service-level infrastructure improvements. Solid waste management accounts for thirty percent of the allocation. Sanitation and wastewater systems contribute twenty-two percent while visible environmental hygiene represents seventeen percent. The remaining percentage combines economic productivity metrics with extensive citizen feedback collected via digital reporting applications and randomized ground interviews conducted by certified assessors throughout a designated forty-five day assessment window.
Does winning a national cleanliness award directly improve property investment prospects?
High civic ratings correlate strongly with stabilized rental yields and faster transaction cycles in targeted neighbourhoods. Tenants gravitate toward areas featuring dependable refuse collection, operational drainage networks, and reduced vector-borne disease risks. Developers responding to these market preferences integrate rainwater recycling, energy conservation measures, and expanded landscaping into new projects. Institutional capital prefers funding portfolios within these jurisdictions due to lower environmental compliance risks and stronger long-term asset liquidity profiles across major Indian metros.
Should homebuyers worry about specific wards failing to match their city's overall ranking?
Municipal awards calculate average performance across entire urban boundaries rather than guaranteeing pristine conditions inside every residential pocket. Funding concentrates along arterial roads, commercial districts, and recently approved township layouts while legacy neighbourhoods often face delayed infrastructure upgrades. Prospective purchasers must physically inspect basement ventilation, monitor street drainage functionality during peak rainfall, and confirm whether nearby societies depend on private contractors or direct municipal support before finalizing allocations.
Enjoyed this blog article? Visit PropTech Pulse for more interesting blogs.



Ask Pulse Ai anything about real estate

Unlock the Latest in Real Estate
News, Infographics, Blogs & More! Delivered to your inbox.